Free Cheat Sheet — Tuesday, August 25
Today's best home run prop targets, ranked by Statcast power scores, platoon matchups, park factors, and weather — free, updated daily.

Kyle SchwarberHOT
PHI vs SEA · Batting 1st
39 HR · 17.5% BRL · 16.5% BRL vs RHP
+240
FanDuel
Power score: 69.7
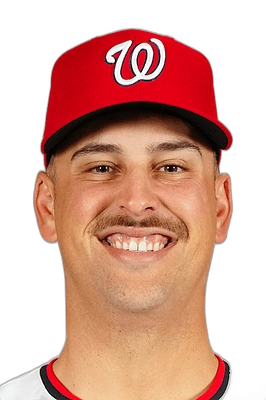
Nathaniel Lowe
CLE vs LAA · Batting 5th
15.3% BRL vs RHP · 14 HR · 14.9% BRL
+250
DraftKings Pick6
Power score: 64.7

Byron Buxton
MIN vs ATH · Batting 2nd
25 HR · 16.0% BRL · 17.3% BRL vs LHP
+240
FanDuel
Power score: 60.5

Bryce Harper
PHI vs SEA · Batting 3rd
19.9% BRL vs RHP · 26 HR · 16.9% BRL
+430
FanDuel
Power score: 59.7
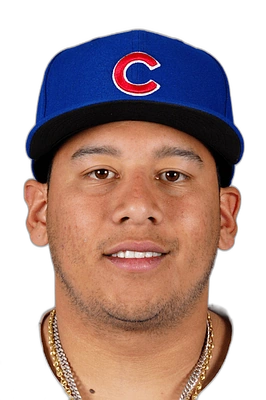
Moises Ballesteros
LAA vs CLE · Batting 3rd
13.7% BRL vs RHP · 14.1% BRL · 6 HR
+330
DraftKings Pick6
Power score: 56.1
This is a preview — members see the full HR Props Cheat Sheet.
Every game, every player, full stat breakdowns, live odds comparison across 15+ sportsbooks, and 8 more daily cheat sheets.
Unlock the Full SheetHome run props are one of the most popular MLB markets, but recent HR totals are a poor predictor on their own. The signal lives in the underlying contact quality: barrel rate, average exit velocity, hard-hit rate, and launch angle. A hitter barreling the ball at a high rate will find the seats even if the box scores have not caught up yet.
Matchup context does the rest. Platoon splits (how the batter performs against today's starter handedness), career history against the pitcher, and the pitcher's own home-run vulnerability all shift a hitter's true HR probability. Then the environment: park HR factors and weather — wind direction, temperature, and roof status — can move home run likelihood by double-digit percentages.
Because HR props typically pay +200 or longer, small edges compound fast — but so does variance. Compare odds across books before betting (our members see prices from 15+ sportsbooks side by side), and consider sizing stakes with a Kelly calculator.
Each batter gets a composite power score built from Statcast data: barrel rate, average exit velocity, hard-hit rate, ISO, and launch angle — weighted by the platoon matchup against today's starting pitcher. That gets adjusted for the ballpark's HR factor and the day's weather to produce a final ranking.
Barrel rate measures how often a hitter makes contact at the exit velocity and launch angle combination most likely to produce home runs. It is one of the most predictive Statcast metrics for future power output — far more stable than recent HR totals alone.
Even elite sluggers usually pay plus-money to homer — commonly +200 to +500 depending on the hitter, pitcher, and park. Because hit rates are low, HR props are high-variance bets: line shopping across books and betting only strong environments matters more than in most markets.
The sheet refreshes throughout the day as starting lineups, pitchers, weather, and odds are confirmed — typically starting the morning of each MLB slate. Confirmed batting orders matter: a hitter in the heart of the order gets more plate appearances.
The top targets of the day are free. PropsEdge members get the full sheet: every lineup with complete Statcast profiles, batter-vs-pitcher history, platoon splits, park and weather factors per game, and HR odds compared across 15+ sportsbooks.
